Is house price growth slowing in South Africa?
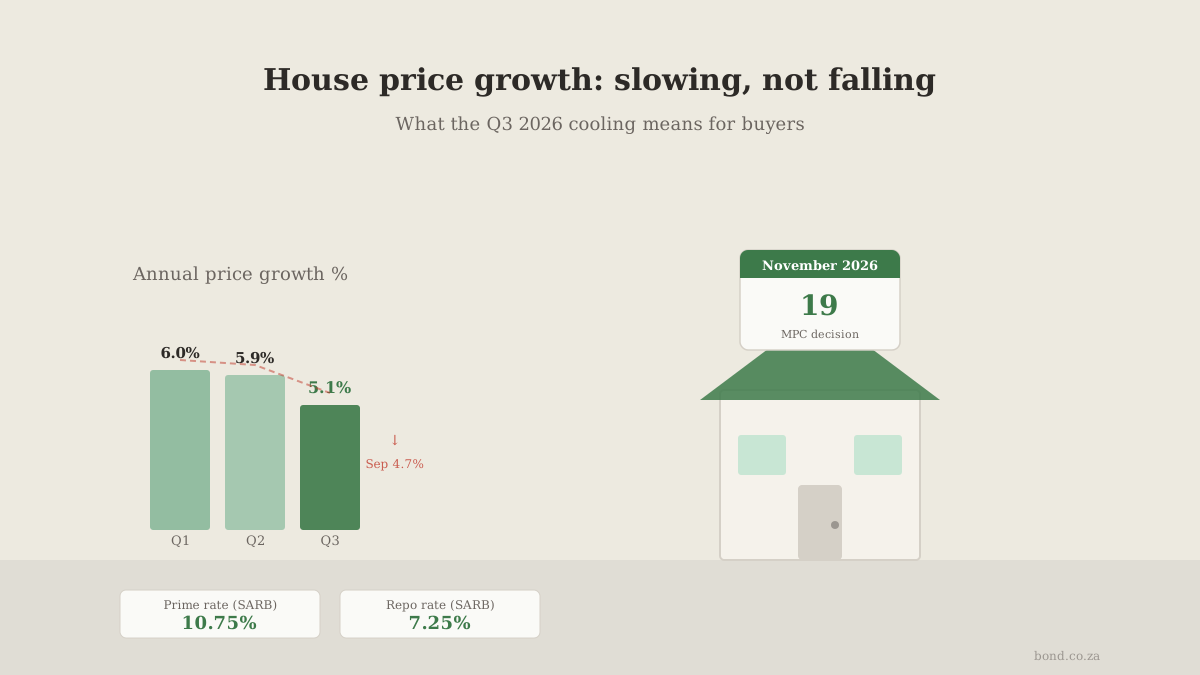
Yes. Average annual house-price growth slowed to 5.1% in the third quarter of 2026, from 5.9% in Q2 and 6% in Q1, per FNB's Property Barometer (November 2026 edition). The monthly series shows the same fade: year-on-year growth eased from 5.4% in July to 4.7% in September, and month-on-month growth in September was just +0.02%. Prices are still rising nationally — the pace is easing, not turning negative.
| Quarter (2026) | Annual house-price growth |
|---|---|
| Q1 | 6.0% |
| Q2 | 5.9% |
| Q3 — latest reading | 5.1% |
The monthly detail shows where the trend is heading into the final quarter:
| Month (2026) | Year-on-year growth | Month-on-month growth |
|---|---|---|
| July | 5.4% | +0.29% |
| August | 5.1% | +0.25% |
| September | 4.7% | +0.02% |
For context on what the money in your pocket is doing: Stats SA put actual rentals up 3.9% year-on-year in September — tenants are still feeling increases even as purchase-price growth cools.
Why is house price growth slowing?
The main brake is affordability, tightened by two SARB rate hikes in 2026 that took prime to 10.75% (effective 25 September 2026). FNB senior economist Siphamandla Mkhwanazi says: “Prices are still rising nationally, but the premium over consumer inflation has narrowed and the wealth effect support to household spending is fading.” — and identifies affordability, especially for first-time, mortgage-dependent middle-income buyers, as the key constraint on the market.
The rate hikes have also thinned the buyer pool. Seeff Property Group chairman Samuel Seeff reports that the two 2026 hikes reduced the number of active buyers, with the Western Cape the exception to the trend. Fewer active buyers means sellers face longer marketing times and buyers face less competition — which is exactly what softer price growth reflects.
Where is house price growth still strong?
The Western Cape. Pam Golding Properties' Q3 2026 index puts national growth at 4.9%, but the Western Cape at 11.5% — more than four times Gauteng's 2.9% and far ahead of KwaZulu-Natal's 2.2%. Semigration demand and limited supply keep the province in a different cycle from the rest of the country, a pattern both FNB and Seeff flag in the Q3 commentary.
| Region (Q3 2026, Pam Golding index) | Annual growth |
|---|---|
| National | 4.9% |
| Western Cape | 11.5% |
| Gauteng | 2.9% |
| KwaZulu-Natal | 2.2% |
Will house prices fall in South Africa?
FNB's base case says no national correction. The bank forecasts slower nominal price growth with constrained transaction volumes — prices grinding higher at a reduced pace, not falling. September's +0.02% month-on-month print shows how close to flat the market has run at the national level, but a near-zero month is not a decline, and year-on-year growth remains positive in every series tracked. Regional divergence is the real risk: slower provinces feel flat long before the Western Cape does.
Watch the 19 November 2026 MPC decision for the direction of borrowing costs: relief on the repayment side would do more for activity than anything happening on the price side.
Is now a good time to buy while growth is slowing?
Slowing price growth removes the fear of being priced out, but it does not make borrowing cheap: prime is 10.75%, and banks price off your credit profile and deposit either way. The average concession banks grant across the bonds originator ooba registers is about 0.67% below prime — so the rate you secure matters more than the month you buy in. At 10.75% prime over 20 years, the repayments look like this (computed by bond.co.za):
| Home loan size | Rate | Monthly repayment |
|---|---|---|
| R 1 000 000 | 10.75% | R 10 152 |
| R 1 500 000 | 10.75% | R 15 228 |
| R 2 000 000 | 10.75% | R 20 305 |
The practical read: if you are ready — deposit saved, credit clean, budget stress-tested at today's rate — a slower market gives you more choice and more negotiating room than the frenzied patches of recent years. Get a bond pre-approval (valid 90 days) so you can move decisively, and model your own scenario in the bond repayment calculator. If affordability is the question, the home loan affordability calculator shows what a bank would count. No bank guarantees approval or a rate; both depend on your profile on the day.
(Last updated 10 November 2026. House-price figures: FNB Property Barometer, November 2026 edition, released the week of 5 November 2026, verified via The National's 5 November report; regional split per Pam Golding Properties Q3 2026 index; rentals per Stats SA. Prime rate 10.75% verified against the SARB September 2026 MPC statement. Repayment examples: 20-year term at the stated rate, no margin — your actual rate may be prime plus or minus a margin.)